


Standard Deviation is the index of the degree of dispersion and an estimate of the variability in the population from the sample. The SD is also known as the variance coefficient (VC). The standard deviation is considered the most appropriate statistical tool for comparing the variability of two or more groups. It forms the base for several statistical techniques such as skewness, kurtosis, ANOVA, etc.
In this article, we are going to explore the most familiar concept of statistics, Standard deviation. Standard Deviation has different formulas as per different data sets. We will learn how these formulas are generated and will read the importance of standard deviation in the real world.
What is a Standard Deviation?
From a statistical perspective, Standard deviation is a statistical measure that shows the degree of variation of a set of values from their mean (average). It calculates the deviation of a single data point from the variance or mean.

From a financial perspective, standard deviation helps investors quantify the risk of an investment and find the minimum return required for an investment. The high value of standard deviation means that most of the scores are away from the group mean and vice versa.
It is the index of the spread of scores about the mean that involves every observation. Greater than standard deviation indicates that the distribution has the majority of low values. A lower than standard deviation means that the distribution has the majority of high values.
Formulas for Standard Deviation:
These two standard deviations (sample standard deviation and population standard deviation) are calculated in different ways.
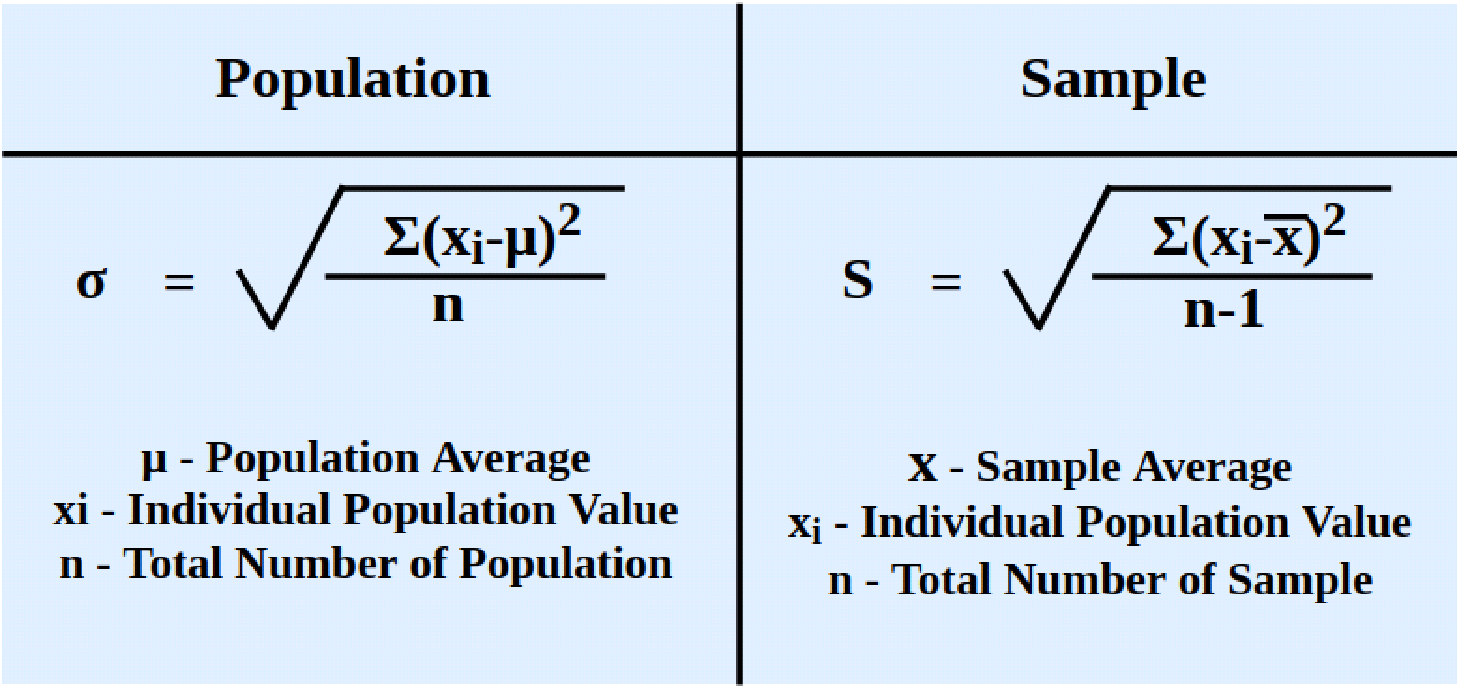
Population Standard Deviation (PSD):
Usually, when we talk about SD in statistics that’s mean we are interested in the standard deviation of the population. However, consistent data from a sample is provided, so the sample standard deviation can be used to estimate the population standard deviation.

Mathematically:
√σ2 = √ Σ (xi – μ)2 / n
σ = √Σ (xi – μ)2 / n
Ready to calculate the SD of population data.
Sample Standard Deviation (SSD):
In statistics, sample standard deviation is often necessary to calculate.

Mathematically:
√s2 = √ Σ (xi – x̄)2 / n – 1
s = √Σ (xi – x̄)2 / n – 1
Ready to calculate the SD of sample data.
Properties of Standard Deviation:
Example:
Example (1): There are eight candidates in the general knowledge exam, and a maximum of 20 marks could be taken. Here is the obtained marks data by candidates; 14,11, 9, 7, 16, 5, 8, 10
Calculate population standard deviation of the given data.
Solution:
| No. of Obs | Xi | (Xi – μ) | (Xi – μ)2 |
| 1 | 14 | 14 – 10 = 4 | 16 |
| 2 | 11 | 11 – 10 = 1 | 1 |
| 3 | 9 | 9 – 10 = -1 | 1 |
| 4 | 7 | 7 – 10 = -3 | 9 |
| 5 | 16 | 16 – 10 = 6 | 36 |
| 6 | 5 | 5 – 10 = -5 | 25 |
| 7 | 8 | 8 – 10 = -2 | 4 |
| 8 | 10 | 10 – 10 = 0 | 0 |
| N = 8 | Σx = 80 | — | ∑(Xi – μ)2 = 92 |
Number of candidates = n = 8
Step 1 – Compute Population Mean.
μ = 80/8 = 10
Step 2 – Compute the deviation of each point from the mean value.
Step 3 – Compute the variance.
Step 4 – Take the variance under the square roots.
√σ2 = √Σ (xi – μ)2 / n
σ = √11.5
PSD = σ ≈ 3.391
Example (2): Mark Williams is a weight lifter who lifts the weight (kgs) 6 times in practice sessions under the 70 kg category. Find the sample standard deviation of the lifted weights which are following:
125, 130, 135, 140, 145, 150
Solution:
| No. of Obs | Xi | Xi – X | (Xi – X)2 |
| 1 | 125 | -12.5 | 156.25 |
| 2 | 130 | -7.5 | 56.25 |
| 3 | 135 | -2.5 | 6.25 |
| 4 | 140 | 2.5 | 6.25 |
| 5 | 145 | 7.5 | 56.25 |
| 6 | 150 | 12.5 | 156.25 |
| N = 6 | Σx = 825 | — | ∑(Xi – x̄)2 = 437.5 |
No. of time mark lift the weights = n = 6
Step 1 – Compute Population Mean.
x̄ = Σx / n
x̄ = 825/6 = 10 = 137.5
Step 2 – Compute the deviation of each point from the mean value.
Σ(xi – x̄)2 = 437.5
Step 3 – Compute the variance.
s2 = Σ(xi – x̄)2 / n – 1 = = 437.5/7 = 62.5
Step 4 – Take the variance under the square roots.
√s2 = √Σ (xi – μ)2 / n – 1
s = √62.5
SSD = s ≈ 7.905
Wrap up:
This content contains a small interpretation of the concept of standard deviation in statistics. We’ve discussed the definition of standard deviation and learned how its formulas formed mathematically. In the end, properties and examples help you to understand the upper discussion. After reading this article, you can evaluate the standard deviation of population data and sample data.


![[2026] 7 Best AI Tools to Unblur Image Details and Rescue Blurry Photos](https://i0.wp.com/lawbhoomi.com/wp-content/uploads/2026/07/2026-7-Best-AI-Tools-to-Unblur-Image-Details-and-Rescue-Blurry-Photos.jpg?fit=1024%2C683&ssl=1)
